A reader asked if I might refer him to a cogent, while pithy, elaboration of the natural historian’s concept of race, an exposition which he might cite in future discussions. One of the most lucid articulations which I have encountered can be found in physical anthropologist Alice Brues’ (1913 –2007) book “People and Races” (1977/1990). Brues studied under Earnest Hooton, whose own concept of race was remarkably well articulated and coherent. In undergrad, she majored in philosophy (and psychology), a fact which might help account for the unusual lucidity of her discussion. In the seven pages of her first chapter, she says most of what needs to be said. And in the remaining chapters she makes the other necessary points. The first chapter is copied below both in PDF form and text. The discussion can be summarized as follows (with my notes added and paragraphs numbered). Continue reading
Race
Bias in Measures of Implicit Racial Bias
It is claimed that implicit association tests, or IATs, reveal unconscious biases against racial and ethnic minorities and other stigmatized groups. The tests are simple and their results appear to be straightforward to interpret: if you are quicker to associate positive words (or other positive stimuli) with the non-stigmatized group (e.g., whites) and quicker to associate negative words with the stigmatized group (e.g., blacks), you have an implicit preference for the former and against the latter. Moreover, it has been shown that IAT scores are (modestly) related to arguably discriminatory behaviors. Given that the IAT scores of most people suggest that they are biased against stigmatized groups, it has been claimed that implicit biases explain discriminatory behaviors in the real world.
Hart Blanton, a long-term critic of various theoretical and methodological absurdities in the IAT paradigm, has written, with some colleagues, a paper challenging a key assumption of the IAT. Re-analyzing several published implicit bias studies, they found that the standard IAT scoring procedure will typically label as implicitly biased people whose observed behavior is neutral and unbiased. IAT researchers assume that individuals who associate positive and negative IAT stimuli with different groups with equal ease are unbiased, but the research by Blanton et al. suggests that such individuals tend to be biased in favor of the stigmatized group. In other words, the zero point of the IAT scale is not associated with behavioral neutrality.
The results of Blanton et al. are pretty straightforward, but not necessarily easy to understand, so I’ll try to clarify them a bit. Continue reading
Nature of Race (Published)
Below is an expanded and much improved rewrite of a draft which I had posted last year — improved thanks to the helpful commentary of Davide Piffer, Emil Kirkegaard, Kevin MacDonald, Peter Frost, Meng Hu, and others. As for the work, the intent was to clarify the concept of race, understood from the perspective of natural history, so to render the term which describes it inessential. It is hoped that the piece will also clarify the purpose of this blog, the focus of which is human varieties, of which races as constant varieties and natural divisions are but a subtype.
Fuerst, J. (2015). The Nature of Race. Open Behavioral Genetics.
Abstract: Racial constructionists, anti-naturalists, and anti-realists have challenged users of the biological race concept to provide and defend, from the perspective of biology, biological philosophy, and ethics, a biologically informed concept of race. In this paper, an onto-epistemology of biology is developed. What it is, by this, to be “biological real” and “biologically meaningful” and to represent a “biological natural division” is explained. Early 18th century race concepts are discussed in detail and are shown to be both sensible and not greatly dissimilar to modern concepts. A general biological race concept (GBRC) is developed. It is explained what the GBRC does and does not entail and how this concept unifies the plethora of specific ones, past and present. Other race concepts as developed in the philosophical literature are discussed in relation to the GBRC. The sense in which races are both real and natural is explained. Racial essentialism of the relational sort is shown to be coherent. Next, the GBRC is discussed in relation to anthropological discourse. Traditional human racial classifications are defended from common criticisms: historical incoherence, arbitrariness, cluster discordance, etc. Whether or not these traditional human races could qualify as taxa subspecies — or even species — is considered. It is argued that they could qualify as taxa subspecies by liberal readings of conventional standards. Further, it is pointed out that some species concepts potentially allow certain human populations to be designated as species. It is explained why, by conventional population genetic and statistical standards, genetic differences between major human racial groups are at least moderate. Behavioral genetic differences associated with human races are discussed in general and in specific. The matter of race differences in cognitive ability is briefly considered. Finally, the race concept is defended from various criticisms. First, logical and empirical critiques are dissected. These include: biological scientific, sociological, ontological, onto-epistemological, semantic, and teleological arguments. None are found to have any merit. Second, moral-based arguments are investigated in context to a general ethical frame and are counter-critiqued. Racial inequality, racial nepotism, and the “Racial Worldview” are discussed. What is dubbed the Anti-Racial Worldview is rejected on both empirical and moral grounds. Finally, an area of future investigation – the politics of the destruction of the race concept – is pointed to.
Keywords: natural division, race, biology
Contents
Introduction………………………………………..………………………………………………………………………………………..4
I. Biology – A Philosophical Clarification…………………………………………..………………………………..……..5
I-A. Existing Views: Confusions Abound
I-B. Biological Concepts in General
I-C. The Validity of Biological Concepts
I-D. Biological Kinds
I-E. Natural Biological Divisions
I-F. Races as Natural Biological Divisions
I-G. The Intraspecific Natural Division as Type of Biological Variation
I-H. The Natural Division as a Taxonomic Unit
I-I. Natural Divisions and Intraspecific Variation with Regards to the Subspecies Category
I-J. Biologically Meaningful Race Concepts
I-K. Biological Reality
I-L. Biologically Important Differences
I-M. Concepts of Biological Race
II. The General Biological Race Concept………………………………………………………..………………..……..25
II-A. The Genealogy of the Concept
II-B. Semantic Complexities and the Evolution of the Race Concept
II-C. Biological Race
II-D. What the Core Biological Race Concept Does Not represent
II-E. Races, Clines, Clusters?
II-F. Clarification on the Meaning of “Arbitrary” and “Objective” in Context to Natural Divisions
II-G. Regarding Different Definitions of Biological Race: What Races Need Not Be
II-H. Genomic-Genealogical Complications
II-I. Estimated Genomic Similarity: Some Ambiguity
II-J. Race: Mixed and Undifferentiated
II-K. Essential and Cluster classes; Fuzzy and Discrete Sets
II-L. Sociological Clarifications
III. The Ontology of Biological Race……………………………………………….……………………………………..……62
III-A. Other Defenses of Biological Race
III-B. Biological Races and Biological Reality
III-C. Thin Biological Racial Essentialism
IV. The Races of Man……………………………………………………………………………………………………………………81
IV-A. A Very Brief Historical Review
IV-B. Human Biological Races and Scientific Consensus
IV-C. Racial Classifications and Biological Race Concepts
IV-D. Traditional human Races
IV-E. THRs and Biologically Objective Races
IV-F. THRs and Migration, Intermixing, and Ancient Admixture
IV-G. THRs and Cluster Discordance
IV-H. THRs and Taxonomy
IV-I. THRs and Subspecies
IV-J. Are There Human Species?
IV-K. “Significant” Racial Differences
IV-L. Human Biodiversity (HBD) and Society
IV-M. Race and Intelligence
V. Critique of Anti-Biological Race Arguments………………………………….…………………………………….126
V-A. Anti-Biological Arguments
V-B. Biological Scientific Arguments
V-C. Sociological Arguments
V-D. Unnaturalistic Arguments and the Numbers Game
V-E. Onto-epistemology Arguments
V-F. Semantic Arguments
V-G. No-True-Race Arguments
V-H. Teleological Argument: The Future of Race
V.I. Can a Good Argument be Made Against (the) Race (concept)?
VI. A Troublesome Inheritance?…………………………………………………………………………………………………148
VI-A. The Social Destruction of a Biological Reality
VI-B. A Not So New Morality for Race
VI-C. The Moral Critiques: Arguments based on Outcome Differences
VI-D. The Moral Critiques: Arguments based on Racial Classification and Identity
VI-E. The Moral Critiques: Arguments based on Racial Favoritism
VI-F. The Moral Critiques: Arguments based on the “Racial Worldview”
Conclusion…………………………………………………………………………………………………………….……………………169
References…………………………………………………………………………………………………………………………………170
Regional Admixture and Aptitude in Colombia
Emil and I set out to determine if regional variation in racial ancestry could (statistically) explain regional variation in cognitive ability. To keep things simple, we have limited focus to the Americas, which contain primarily trihybrid populations and for which there is a decent amount of admixture data. The results so far align with predictions. Both across nations and across regions within the U.S., Brazil, and Mexico, European ancestry positively correlates with regional-level cognitive ability. In contrast, both African and Amerindian ancestry negatively so correlates. The broader importance of the project is that it involves the construction of an expansive data set which allows for the statistical controlling of continental lineage and associated factors (genes + deep culture), ones which presently confound many analyses. This data set will hopefully allow one to uncover regional and national level factors which are not tangled with ancestry. They must exist. For example, we find that regional levels of European ancestry are associated with better outcomes in both the U.S. and Brazil but also that there is a substantial between nation effect that can not be explained by factors correlated with continental ancestry.

Here, I will discuss a new analysis involving Colombia. Colombia is marked by extensive spatial variation in  ancestry. The admixture map on the left copied from Ruiz-Linares et al. (2014) and the ethnic map on the right taken from Rodriguez-Palau et al. (2007) roughly capture the lay of the land. African admixture is concentrated along the Pacific and Caribbean coast, European admixture is highest in the north and central interior region, and Amerindian admixture is concentrated in the east and south. This ancestral variation allows for a test of our general model.
I computed the variables as follows:
Admixture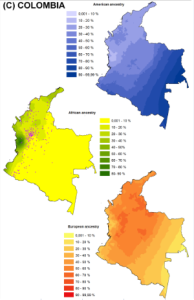 : Estimating regional admixture for Colombia’s 32 departments plus the capital was not without difficulty since existent studies provide admixture data for only half of the departments. Problematically, specific estimates for the eastern and southeastern departments, which are reported to have high Amerindian components were not available. Nonetheless, we were able to construct three sets of admixture estimates. First, 18 departmental + capital estimates were taken from Salzano and Sans’ (2014) compilation. The ancestry ratios from Salzano and Sans’ (2014) two main sources correlated at 0.9, so we felt that using the combined estimates was justified. Second, missing values were filled in based on regional values and based on Ruiz-Linares et al.’s (2014) and Rodriguez-Palau et al.’s (2007) maps. For example, estimates for Caribbean-Pacific departments were averaged and used to fill in missing data for other departments in this region. In context to the U.S., this would be akin to filling in South Carolina values using the average of the Deep South ones. Third, admixture was estimated using ethnic identity data from the 2005 census in conjunction with average ethnoracial admixture percents as reported in all available studies. The ethnoracial admixture percents came out to as follows:

The computation methods are detailed more precisely in the excel file.
Cognitive ability: For cognitive scores, the Colombian national SABER exam scores were used. The average of the 2003 and 2005 grades 5 and 8 math and reading regional scores strongly correlated with the average of the 2012 and 2014 scores (about 0.85). The scores were on different metrics, moreover standard deviations were not available for the 2003 and 2005 scores (given the source used), so, in the end, the 2012 and 2014 average scores were employed.
Other variables: 2010 HDI scores were taken from Machado (2011). Ethnic identity percents were taken from the 2005 census. Population was taken from the census via Wikipedia.
Results: I uploaded the excel file to facilitate future investigations. For the analyses reported below, in line with the general methods adopted for the meta-project, I excluded the capital and weighted by SQRT(population). Salzano and Sans’ (2014) admixture data showed only a weak negative correlation for Amerindian ancestry; this was because, as noted, data was missing for the most Amerindian parts of the country. When data was filled in, the association became significantly negative as predicted. It seems that the negative results are driven by the low scores in 5 districts (Amazonas, La Guajira, Guainía, Vaupés, and Vichada) all of which have high percents of self identifying indigenous and large reservations.

The results immediately above were replicated using the ethnic-admixture data.

Generally, European ancestry was non-trivially associated with cognitive ability (shown below) and with HDI (not shown). These results held regardless of which admixture variable was employed; they were largely driven by the strong negative association between regional outcomes and African ancestry. It is interesting that regional Amerindian ancestry was not associated with regional ability in the case of Salzan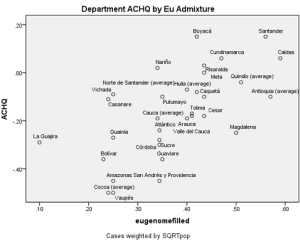 o and Sans’ (2014) admixture estimates. While on the national level, Amerindian ancestry negatively correlated with ability, as areas which were heavily populated by self-identifying Indigenous individuals did poorly, one might expect a more constant effect, one that would show up in Salzano and Sans’ (2014) restricted data set, which included only interior and coastal departments. The lack of association might have been due to the unreliability of the data, the specific samples analyzed, or the specific sampling of interior and coastal departments. Possibly, Amerindian ancestry is not negatively correlated with regional outcomes outside of largely indigenous regions. A determination of the matter will have to wait for the publication of more Colombian regional admixture data.
Racial Ancestry in the Americas. Part 2: Cognitive Variation between Nations: Parasite Load, Climate, and Ancestry
Following up with a previous analysis, I examined the cognitive variation across the whole of the Americas using a newly constructed data set. Files can be found here and here, with the latest versions provided on request. The analysis was restricted to sovereign nations, not e.g., departments such as Martinique or territories such as the Virgin Islands. Non-sovereign regions were excluded so to avoid an inter-nation x intra-national interaction and because international exam data was not available for these regions. The following 35 countries were included: Argentina, Antigua and Barbuda, Bahamas The, Belize, Bolivia, Brazil, Barbados, Chile, Colombia, Costa Rica, Cuba, Dominica, Dominican Republic, Ecuador, Guyana, Grenada, Honduras, Haiti, Jamaica, St. Kitts and Nevis, St. Lucia, Mexico, Nicaragua, Panama, Peru, Paraguay, El Salvador, Suriname, Trinidad and Tobago, Uruguay, United States, St. Vincent, Venezuela RB, and Canada. Eight regression analyses were run, using the following dependent variables:
- (Skinrefl) Skin reflectance.
- (AchQ) National Achievement Scores – this was an updated set provided by Gerhard Meisenberg during October of 2014.
- (NIQ) National IQ scores – these were based on Richard Lynn’s 2014 (work in progress) results and Jason Malloy’s 2013 to 2014 estimates, with adjustments.
- (AHQ) 1880 to 1930 birth cohort age heaping scores — this is a measure of education/numeracy.
- (logSciresearch) Log of scientific researchers from 2005 to 2012.
- (logGDP) Average of 1990, 2000, and 2010 log of World Bank per capita GDP.
- (Crimes) Violent Crime rates.
- (HDI2012) 2012 Human Development Index scores.
The following independents were included:
- (relativeEu) European Ancestry percent — the percent of European ancestry out of the percent of European + Amerindian + African ancestry. (For a discussion of this variable, refer here.)
- (notUSCanada) Not US or Canada — whether the region was not US or Canada.
- (logparasiteload) Log Parasite load — the log of the 2004 WHO parasite infections per 100,000 for each country.
- (logColddemand) Log Cold demand — the log of Van de Vliert’s (2013) cold stress scores.
- (PopUnder1million) Population under 1 million — whether the country’s population was under one million.
Simple correlation analysis demonstrated that ancestry, cold weather, and parasite load intercorrelated. This situation renders difficult the isolation of causal associations. To illustrate, skin reflectance was set as a dependent with Eu ancestry, cold weather, parasite load, population under 1 million, and not US and Canada as independents. The correlation between Eu ancestry and skin reflectance is clearly mostly genetic in origin. To the extent that the association between ancestry and skin reflectance is mediated by other variables, it is suggested that these variables co-vary with causal effects related to genes (and thus that controlling for them controls for ancestry related causal effects). Regression results are shown in Table 1, below. Generally, parasite load and cold weather seem to partially index ancestry effects. Parasite load is a particularly problematic “environmental factor” because it significantly correlates with STD and HIV rates (at 0.47). Yet the spread of HIV throughout the Americas, in the ’70s and ’80s, was subsequent to the origin of cognitive ability differences, which, in the form of national age heaping rates, were already present in the 1800s. Thus, STD and HIV rates and with them parasite load are, to some extent, consequent of cognitive ability differences.
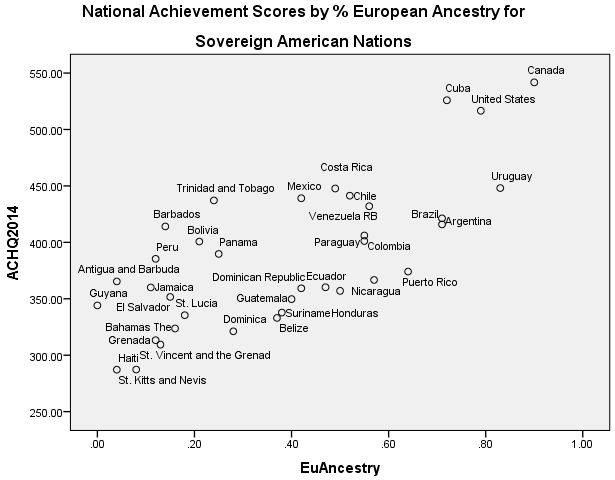
Results will not be discussed in detail. The data file is made freely available; readers can run the analyses as desired. Generally, European ancestry was a robust predictor of lower rates of violent crime, scientific activity, and achievement scores, and achievement plus National IQ scores. (For national IQ alone, in the final model, none of the predictors were significant; this was because the NIQ sample had many missing values.) In contrast to cognitive ability and the other mentioned indexes, European ancestry was generally not significantly associated with GDP or Human developmental indexes. The results for National achievement scores are shown in Table 2, below; a regression plot is shown in figure 1.
Table 1. Regression Results for Skin reflectance
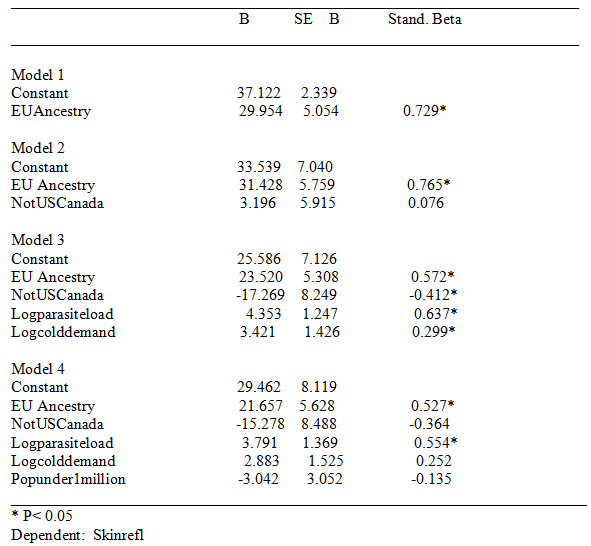
Table 2. Regression Results for ACHQ2014
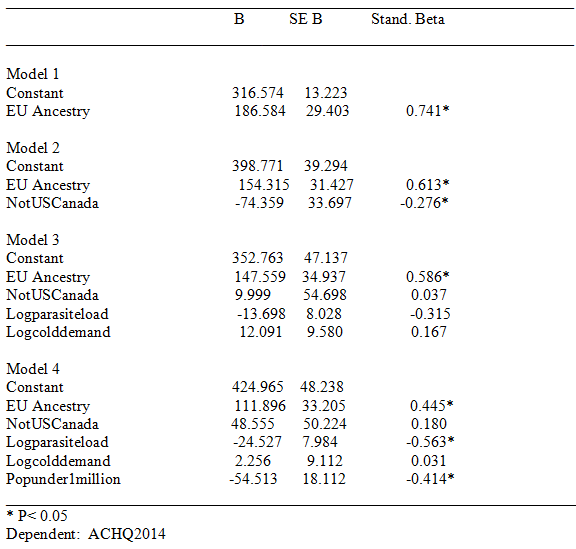
Figure 1. National Achievement Scores by % European Ancestry for Sovereign American Nations
Racial Ancestry in the Americas. Part 1: National Genomic Racial Admixture: Estimates and Validation
It has been noted that in the Americas racial identification and genomic racial ancestry frequently don’t well correspond. In Latin America, the association seems to be modest on the individual level. For example, Ruiz-Linares et al. (2014) found a correlation of 0.48 between self-identified European and Amerindian racial identity and genomic ancestry in a five country sample. In principle, the same could hold on the aggregate national level. And in some instances there’s a clear discordance. While the Argentinean and Brazilian national populations have roughly the same degree of pre-1500 European ancestry, Argentine has a White European national image while Brazil has a multiracial one. One might wonder, then, to what extent average racial self-identification concords with average racial admixture on the national level. This is an interesting question and others in a similar vein can be asked. For example: To what degree are differences in national racial identification related to such and such outcomes independent of genomic ancestry? Perhaps, for example, members of countries with a more European identity act in aggregate different than ones that have developed, net of genotype, a less European one — an acting White effect on the national level. Ruiz-Linares et al. (2014) found that, on the individual level, White identity was associated with wealth (but not educational attainment) net of European ancestry (see note 1). If such a pattern can exist on the level of the individual, it could so on the level of the nation. Here, the first matter will be explored. I first present several indexes of national ancestry for the Americans; these include: national genomic percents, aggregate self- identified race percents, Putterman’s ancestry percents, and national skin reflectance scores. For comparability, these values are expressed in terms of major racial categories e.g., White European, Black African, and Amerindian — plus an “Other” group. I then use correlation analysis to validate these estimates.
District-Level Variation in Continental Racial Admixture Predicts Outcomes in Mexico
Previously, a literature review was conducted regarding continental racial admixture and educational attainment and/or socioeconomic status. Across the Americas, Amerindian and African (versus European) ancestry was found to be negatively correlated in admixed populations (e.g., Hispanic Americans) with income, educational attainment, occupational rank, and other cognitively correlated indexes of socioeconomic status. Multiple possible explanations were discussed. Some of these predict that the ancestry-outcome association will generalize spatially, such that admixture will be correlated with outcomes across regions and nations. This need not be the case and is not directly predicted by other accounts of the individual level admixture-outcome associations, such as phenotypic based discrimination ones, which work on the individual-level. The association between regional ancestral and cognitive related outcome variation in Mexico will first be explored, since for this county reliable regional admixture estimates, at least with regards to European and Amerindian ancestry, and outcome measures are available and also since there is a good deal of spatial variation in admixture (and outcomes). Subsequently, the analysis will be generalized to the whole of the Americas. The Figure 1 below depicts the Mexican spatial ancestral racial variation.
Method: Admixture estimates: Admixture estimates were taken from Salzano and Sans (2014) and Moreno-Estrada et al. (2014). For the two sources, Pearson correlation was 0.94 for European admixture, -0.60 for African Admixture, and 0.94 for Amerindian admixture. Regarding European and Amerindian admixture, the estimates exhibited a high reliability, thus justifying their combination. The African Admixture estimates were unreliable due to the noisiness of the measures in conjunction with the limited range and variance in admixture. Admixture estimates were averaged for each district. Missing district data was then estimated based on the measured admixture of adjacent regions. This produced four different admixture estimates: (a) Salzano and Sans (2014), (b) Moreno-Estrada et al. (2014), (c) the average of (a) and (b), and (d) estimates based on (c) taking into account regional proximity. Descriptives are presented in Table 1. Cognitive Ability estimates: 2003, 2006, 2009, and 2012 average math and reading PISA scores were computed for each district. Regional scores were highly correlated across years, thus justifying the use of cross year average scores; deviation scores relative to the Mexican national mean were computed and averaged across years. 2002 and 2005 average district level Raven’s Matrices scores were also computed. Human Development Index: 2010 and 2012 Human Development Index scores highly correlated across year. And average scores was computed. The excel data file is attached.
Results: Since % African estimates were unreliable, these were treated as noise and this noise was partialed out in the correlation analyses. Thus, for these analyses the total ancestry was the Amerindian + European ancestry. The correlations between district level Amerindian Ancestry (with and without estimates) and district level cognitive ability and human development are shown below. Percent Amerindian Admixture was a strong negative predictor of district level outcomes. Partailing out the noisy African Admixture didn’t have a substantive effect on the correlations. Correlations using estimated and measured only admixture were similar as were ones using averaged admixture estimates and those provided by Salzano and Sans (2014) and Moreno-Estrada et al. (2014) independently. Results are shown in Table 2. The regression plot showing district level admixture (without African ancestry partailed out) and district level cognitive scores is shown in Figure 2. District level cognitive ability substantially mediated the association between continental ancestry and HDI (with and without African ancestry controlled for). (Without African admixture controlled for: Pearson correlation (AmerAdmix x HDI) = -0.603; AmerAdmix x HDI) correlation with PISA scores partailed out: -0.271.)
Discussion: Regional Amerindian Admixture was a robust predictor of regional outcome differences. The Amerindian ancestry -outcome association found based on admixture mapping generalizes spatially, at least in Mexico. These findings are as would be predicted by an evolutionary genetic explanation. Variations of shared environmental — “cultural” — accounts are possible insofar as shared environment can be genealogically sticky.
Tables and Figures:
Continue reading
Is there no population genetic ‘support’ for a racial hereditarian hypothesis?
(10/18/2014 update: data from two additional studies — Martínez et al. (2007) and Ruiz-Linares et al. (2014) — have been added.)
Over the last decade, scores of large scale admixture-mapping studies have been conducted largely in an attempt to elucidate the origin of ethnic disparities in disease rates and medical outcomes. In the simplest type of such studies, researchers determine if there is a robust association between genotypically defined continental racial ancestry (typically: African, European, and Amerindian) and relevant outcomes in admixed populations. To control for potential confounding effects, measures of educational attainment and other indexes of SES are often included in the analyses. These variables are often treated as environmental indicators, which is odd, since within populations they are found to be under non-trivial genetic influence. For example, based on a recent international meta-analysis of biometric studies involving 51,545 kinship pairs, Branigan, et al. (2013) found that educational attainment had a kinship-based heritability of 0.40, meaning that genes explained 40% of inter-individual educational differences; based on a sample involving 7,959 individuals, Rietveld et al. (2013, table S12) found a GCTA-based heritability, one which takes into account only the effects of population-wide common genetic variants, of 0.22. These results were replicated by Marioni, et al. (2014, table 3), who found a kinship-based heritability of 0.40 and a GCTA-based one of 0.21. When genes explain some of the variance in a trait within groups, they plausibly explain an indefinite portion of the variance between groups. Curious it is, then, that these external outcomes are often assumed to represent environmental influences between groups.
Genetic and Environmental Determinants of IQ in Black, White, and Hispanic Americans: A Meta-analysis and New Analysis
The PDF and data file are available at Open Behavioral Genetics. You can also read the article below the cut.
Published: September 15, 2014
John Fuerst [1]
Dalliard
Abstract: The authors conducted a meta-analysis of interactions between behavioral genetic variance components (ACE) and race/ethnicity for cognitive ability. The differences between the variance components for Black and White Americans were small, despite the large average test score differences. More substantial differences were found between Hispanics and non-Hispanic Whites, though results were based on only two studies. A biometric re-analysis of the CNLSY survey was then conducted and new meta-analytic results were provided. Results were discussed in light of the bio-ecological model which proposes that when the scores of subgroups are environmentally depressed, heritabilities will be likewise.
Keywords: Race, Ethnicity, Heritability, IQ, Environment, ACE model, bio-ecological model
Ethnic/Race Differences in Aptitude by Generation in the United States: An Exploratory Meta-analysis
An early version of this paper was posted on June 25th. The paper has since been extensively edited and corrected and, subsequently, published at Open Differential Psychology on July 25/26th, 2014. The paper and data files can be found here at the Open Differential Psychology site.
PDF.
Abstract
Cognitive ability differences between racial/ethnic groups are of interest to social scientists and policy makers. In many discussions of group differences, racial/ethnic groups are treated as monolithic wholes. However, subpopulations within these broad categories need not perform as the racial/ethnic groups do on average. Such subpopulation differences potentially have theoretical import when it comes to causal explanations of racial/ethnic differentials. As no meta-analysis has previously been conducted on the topic, we investigated the magnitude of racial/ethnic differences by migrant generations (first, second, and third+). We conducted an exploratory meta-analysis using 18 samples for which we were able to decompose scores by sociologically defined race/ethnicity and immigrant generation. For Blacks and Whites of the same generation, the first, second, and third+ generation B/W d-values were 0.79, 0.79, and 1.00. For Hispanics and Whites of the same generation, the first, second, and third+ generation H/W d-values were 0.76, 0.67, and 0.57. For Asians and Whites of the same generation, the first, second, and third+ generation d-values were -0.08, -0.21, and 0.00. Relative to third+ generation Whites, the average d-values were 0.99, 0.84, and 1.00 for first, second, and third+ generation Black individuals, 1.04, 0.71, and 0.57 for first, second, and third+ generation Hispanic individuals, 0.16, -0.18, and -0.01 for first, second, and third+ generation Asian individuals, and 0.24 and 0.04 for first and second generation Whites.
Keywords: Immigrants, group differences, race, ethnicity, aptitude, National IQ
